
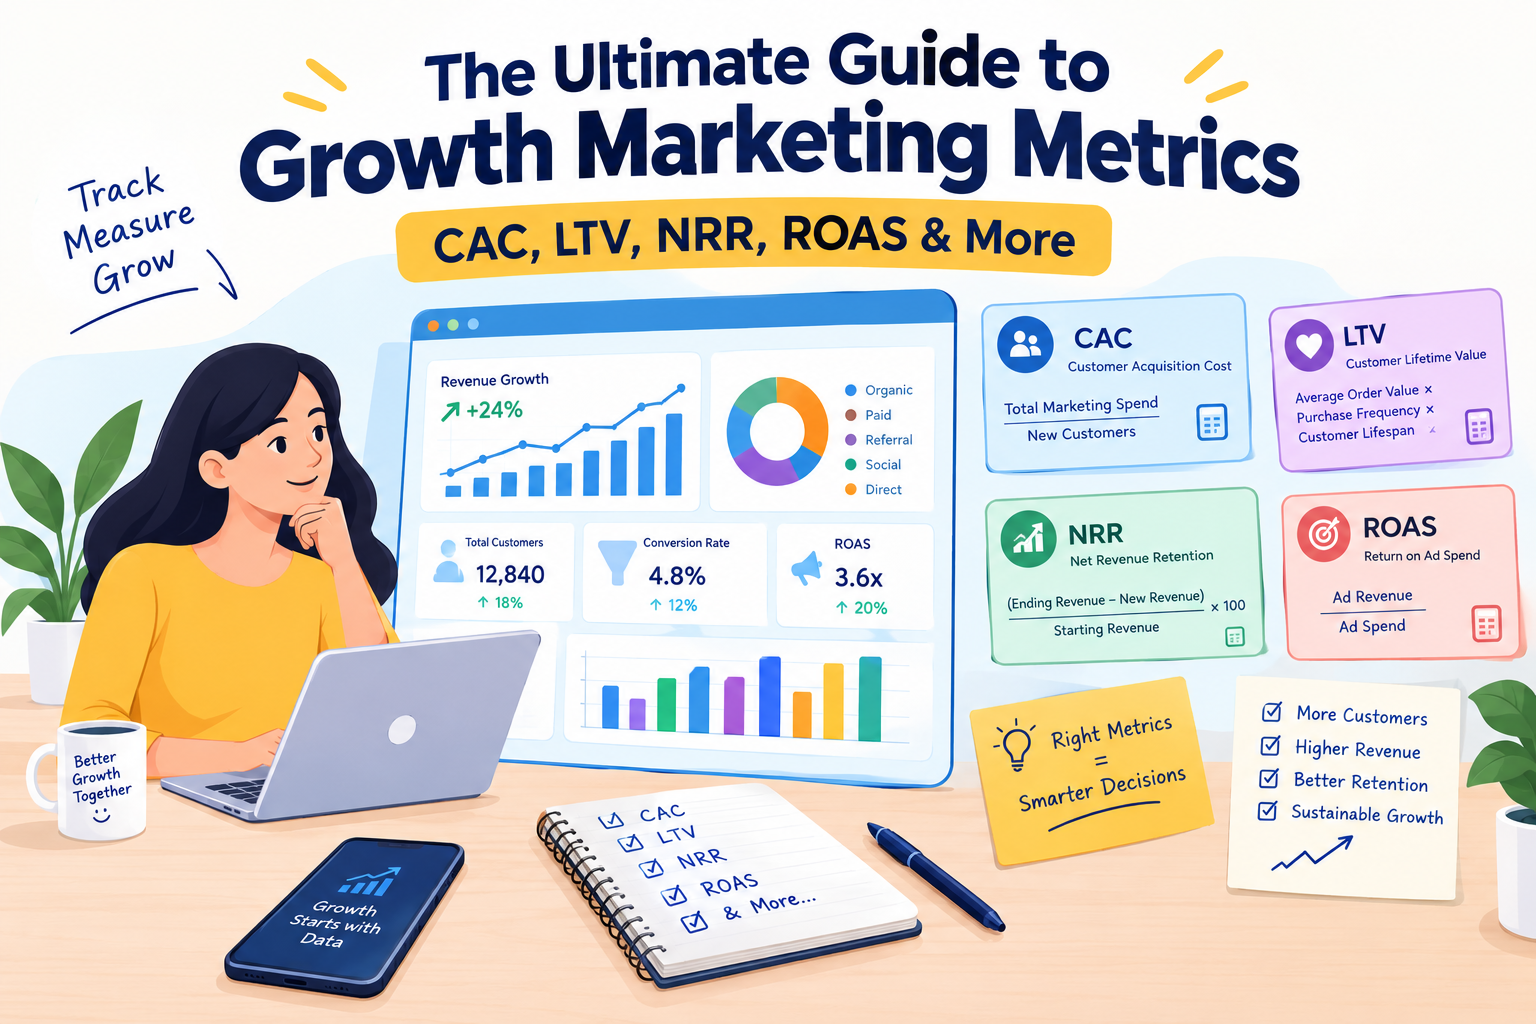
Growth marketing metrics help answer a question every business eventually faces: are we growing profitably, or are we simply spending more to attract customers? A campaign can bring thousands of visitors and still struggle to generate sales. Likewise, a business can report rising revenue while losing valuable customers every month. That is why growth marketing metrics matter beyond marketing dashboards. They connect customer acquisition, buying behaviour, retention and revenue into one clearer picture.
For Indian businesses, the answer often depends on the model. A D2C skincare brand may need to understand repeat purchases and product margins. A SaaS company may focus on recurring revenue and customer retention. Meanwhile, a creator-led campaign may need to prove that its reach translates into qualified visits and purchases. This guide explains the essential growth marketing metrics with formulas, practical examples and decisions you can apply. More importantly, it shows how the numbers work together, so you can identify what to improve before increasing your budget.
- 1. What Are Growth Marketing Metrics, and Why Do They Matter?
- 2. Customer Acquisition Metrics: CAC, CPA and Payback Period
- 3. Customer Value and Revenue Metrics: LTV, LTV, ROAS and NRR
- 4. Retention, Conversion and Funnel Metrics That Explain Growth
- 5. How Influencer Marketing and UGC Fit into Growth Marketing Metrics
- 6. Build a Growth Marketing Dashboard and Turn Metrics into Decisions
- Key Takeaways, and Next Steps
- About Hobo.Video
1. What Are Growth Marketing Metrics, and Why Do They Matter?
Growth marketing metrics are measurements that help a business understand how effectively it attracts, converts, retains and grows customers. They cover the entire customer journey, not just the first click or purchase. For example, a brand may track customer acquisition cost to understand spending, conversion rate to evaluate its sales funnel, and customer lifetime value to estimate long-term customer value. Together, these figures help teams make better decisions about budgets, campaigns and customer experience.
However, tracking more numbers does not automatically create better growth. A business can monitor dozens of indicators and still miss the real problem. Perhaps advertising generates affordable clicks, but the landing page fails to convert visitors. Alternatively, first-time purchases may rise while repeat orders fall. Therefore, the goal is to connect each metric to a business question. If you want a broader introduction, read Hobo.Video’s guide to growth marketing for D2C founders.
1.1 The four layers of a useful growth measurement system
- Acquisition: How much does it cost to attract a new customer?
- Conversion: How many prospects complete the desired action?
- Retention: Do customers return, renew or increase their spending?
- Efficiency: Does the value generated justify the money and time invested?
These layers work together. Strong acquisition cannot compensate forever for weak retention. Similarly, healthy revenue growth can hide poor margins if the business relies heavily on discounts. Therefore, read metrics as a connected system instead of isolated scores.
1.2 Choose metrics according to your business model
A D2C brand, a subscription company and a service business do not need identical dashboards. A D2C brand may prioritise first-order margin, repeat purchase rate and blended acquisition cost. A subscription company needs recurring revenue, churn and net revenue retention. Meanwhile, a service business may focus on qualified leads, sales conversion and the cost of winning a client.
Start by defining the outcome that matters most. Then choose a small set of supporting measures that explain it. This approach makes reporting easier and prevents teams from celebrating activity that does not support business goals.

Amplify Your Brand,
One Influence at a Time.
2. Customer Acquisition Metrics: CAC, CPA and Payback Period
Customer acquisition metrics explain how much a business spends to gain customers and how quickly it can recover that spending. They matter because growth often requires cash before it produces returns. If acquisition costs rise faster than customer value, increasing the budget can make the problem worse. Therefore, teams should examine both the number of customers gained and the full cost of winning them.
2.1 Customer Acquisition Cost (CAC)
Customer acquisition cost measures the average expense required to acquire a new customer during a defined period.
Formula:
CAC = Total acquisition costs ÷ Number of new customers acquired
Suppose an Indian personal-care brand spends ₹3,00,000 on marketing and sales during a month. It acquires 600 new customers. Its CAC is ₹500 per customer.
However, the result depends on which costs the team includes. Paid media is only one part of acquisition. Creator fees, agency charges, campaign production, marketing software and sales salaries may also matter. A business should document its cost definition and use it consistently.
It should also calculate CAC by channel where the data allows. Paid search may attract customers at one cost, while creator content or referrals may attract them at another. Yet the cheapest channel is not automatically the best. A channel with a higher CAC may bring customers who spend more, return more often or generate stronger margins.
2.2 Cost Per Acquisition (CPA)
Cost per acquisition measures the cost of achieving a defined action. Depending on the campaign, that action may be a purchase, signup, booking or completed registration.
Formula:
CPA = Campaign cost ÷ Number of defined acquisitions
For example, a campaign spends ₹40,000 and generates 200 purchases. Its purchase CPA is ₹200. However, another campaign might use a lead form as its acquisition event. That means the two CPA figures would describe different outcomes.
Always name the action being measured. A cost per lead is not the same as a cost per paying customer. Similarly, an inexpensive signup campaign can still perform poorly if most signups never become active users. Therefore, connect CPA with lead quality, conversion rate and the final business result.
2.3 CAC payback period
CAC payback period estimates how long a business needs to recover its customer acquisition cost through the gross profit generated by that customer.
For a subscription business with stable monthly revenue, a simplified formula is:
CAC payback period = CAC ÷ Monthly gross profit per customer
Imagine a software company spends ₹12,000 to acquire a customer. That customer generates ₹3,000 in monthly revenue, with a gross margin of 80%. Monthly gross profit is ₹2,400. The company therefore needs five months to recover its CAC.
This example assumes the customer stays active and revenue remains stable. Real businesses must account for churn, discounts, payment delays and changes in usage. A longer payback period can strain cash flow even when the customer appears valuable over time.
2.4 Blended CAC versus channel CAC
Blended CAC divides total acquisition spending by all new customers acquired. Channel CAC measures the cost associated with a particular channel. Both can be useful, but they answer different questions.
Blended CAC helps leaders understand the overall acquisition picture. Channel CAC helps teams decide where to adjust budgets. However, channel-level reporting can be misleading when multiple channels influence one purchase. A customer may discover a brand through an influencer, search for it later and buy through a retargeting ad.
Therefore, use channel reports to understand performance, but avoid assuming that one channel deserves all the credit. Compare the numbers with customer journeys, conversion data and, where feasible, controlled tests.
3. Customer Value and Revenue Metrics: LTV, LTV, ROAS and NRR
Acquisition tells you what it costs to win customers. Value and revenue metrics help you judge whether those customers can support sustainable growth. This is where many teams discover an uncomfortable truth: revenue can rise without profit improving. To avoid that mistake, connect customer value, campaign returns, recurring revenue and retention.
3.1 Customer Lifetime Value (LTV or CLV)
Customer lifetime value estimates the value a business receives from a customer over the relationship. Some teams calculate lifetime revenue, while others estimate lifetime gross profit. The difference matters because revenue does not account for product costs, fulfilment or servicing expenses.
A simple revenue-based estimate is:
LTV = Average order value × Purchase frequency × Expected customer lifespan
Suppose an online home-care brand has an average order value of ₹800. A typical customer places three orders annually and remains active for two years. Estimated lifetime revenue is ₹4,800.
However, this figure is not profit. If product, shipping and service costs consume much of the revenue, the customer’s economic value will be lower. Therefore, businesses should use gross-profit-based LTV when comparing customer value with acquisition cost.
LTV is also an estimate, not a guarantee. Purchase habits can change, customers can stop buying, and new cohorts may behave differently. Review the assumptions regularly and calculate LTV by meaningful customer groups when sufficient data exists.
3.2 The LTV ratio
The LTV ratio compares estimated customer lifetime value with customer acquisition cost.
Formula:
LTV ratio = Customer lifetime value ÷ Customer acquisition cost
Imagine a business estimates gross-profit LTV at ₹6,000 and CAC at ₹1,500. Its LTV ratio is 4:1. In other words, the estimated lifetime gross profit is four times the acquisition cost.
A ratio above 1:1 does not automatically mean the business is healthy. The company still has operating expenses, overheads and other costs. Many SaaS discussions use 3:1 as a directional reference point, but it is not a universal rule for every industry or growth stage. Subscription businesses, marketplaces and low-margin retail brands have different economics.
Most importantly, use comparable definitions. Do not divide revenue-based LTV by a CAC figure that includes only a small part of acquisition spending. That would make the ratio look stronger than it really is.
3.3 Return on Ad Spend (ROAS)
Return on ad spend measures the revenue attributed to advertising relative to the advertising cost.
Formula:
ROAS = Revenue attributed to ads ÷ Advertising spend
If a campaign spends ₹50,000 and receives ₹2,00,000 in attributed revenue, ROAS is 4.0x. The reporting system attributes ₹4 in revenue to every ₹1 spent on ads.
Yet ROAS is not the same as profit or overall return on investment. Product costs, discounts, returns, creator fees and fulfilment may reduce the actual contribution. Also, attributed revenue does not prove that every sale happened because of the ad.
For a more useful decision, calculate the contribution margin and break-even ROAS. If the business keeps only 40% of revenue after variable costs, a ROAS target should reflect that margin. Otherwise, a campaign can appear successful while losing money after costs.
3.4 Net Revenue Retention (NRR)
Net revenue retention measures how recurring revenue from existing customers changes over a period. It includes expansion revenue, downgrades and lost revenue from churn. It excludes revenue from newly acquired customers.
Formula:
NRR = (Starting recurring revenue + Expansion − Contraction − Churn) ÷ Starting recurring revenue × 100
Suppose a SaaS business begins the month with ₹10 lakh in recurring revenue from existing customers. It gains ₹2 lakh through upgrades, loses ₹50,000 through downgrades and loses ₹1 lakh from cancellations. Its ending revenue from that original customer group is ₹10.5 lakh.
NRR is therefore 105%. The existing customer base generated more recurring revenue than it had at the start, even before counting new customers.
An NRR above 100% indicates expansion outweighed contraction and churn during the period. However, the figure alone does not explain why revenue changed. Review customer segments, pricing, usage and renewal behaviour to find the underlying cause.
3.5 Revenue growth and recurring revenue
Revenue growth rate measures the percentage change in revenue across comparable periods.
Formula:
Revenue growth rate = (Current-period revenue − Previous-period revenue) ÷ Previous-period revenue × 100
For subscription businesses, monthly recurring revenue (MRR) and annual recurring revenue (ARR) can help describe recurring revenue scale. ARR is commonly calculated as MRR multiplied by 12, but businesses should include only revenue that meets their recurring-revenue definition.
For example, a one-time setup fee should not automatically count as recurring revenue. Mixing recurring subscriptions with one-off payments can make the business appear more predictable than it is.
Growth teams should review revenue alongside margin, churn and cash collection. Rising revenue is encouraging, but it does not tell the full story about customer quality or financial health.
4. Retention, Conversion and Funnel Metrics That Explain Growth
Acquisition gets customers through the door. Retention and conversion determine how much value the business can create after that first interaction. These metrics often reveal problems that a top-line revenue figure hides. For example, traffic might be stable while checkout conversion falls, or new subscriptions might rise while existing customers cancel. To measure funnel performance accurately, track actions such as purchases, signups, and lead submissions. The Google Analytics recommended events guide explains which events businesses can configure.
4.1 Conversion rate
Conversion rate measures the share of eligible visitors or users who complete a desired action.
Formula:
Conversion rate = Conversions ÷ Eligible visitors or actions × 100
If 150 out of 3,000 landing-page visitors place an order, the visit-to-order conversion rate is 5%. However, teams must define the denominator. A visitor-based rate may differ from a session-based rate or a click-to-purchase rate.
For an Indian ecommerce brand, conversion rate can vary by device, location, payment option and product category. A page may perform well on desktop but struggle on mobile. A campaign may also attract many curious visitors who are not ready to buy.
Therefore, segment conversion rates where the data supports it. Then investigate the reasons behind changes before immediately increasing advertising spend.
4.2 Customer retention rate and churn
Retention rate measures the share of customers who remain active during a defined period. Churn measures the share who leave or become inactive, according to the business’s definition.
For a customer-count retention calculation:
Retention rate = (Customers at period end − New customers acquired) ÷ Customers at period start × 100
A subscription business may define retention by active subscriptions. A D2C business may instead measure repeat purchases within a chosen time window. Those definitions are not interchangeable, so state which one you use.
Retention matters because repeat customers can generate more revenue without requiring the same level of new-customer acquisition. However, not every repeat purchase is profitable. Teams should consider discounts, product margins and the cost of encouraging another order.
4.3 Repeat purchase rate
Repeat purchase rate measures the share of customers who have purchased more than once during a defined period.
Formula:
Repeat purchase rate = Customers with multiple purchases ÷ Total customers × 100
Suppose 300 of 1,000 customers place at least one additional order within six months. The repeat purchase rate is 30% for that cohort and period.
This metric can help D2C brands assess whether their products encourage continued buying. Yet purchase cycles differ. A household product may run out quickly, while a durable item may not need replacing for years.
Therefore, compare customers over suitable time windows. Also examine repeat purchase value, time to second order and product returns. Together, these measures provide more useful insight than one repeat-purchase percentage alone.
4.4 Activation rate
Activation rate measures how many new users reach a meaningful first experience with a product or service. A signup is not always activation. For a project-management app, activation might mean creating a project and inviting a teammate. For a marketplace, it could mean completing a first transaction.
Formula:
Activation rate = New users completing the activation event ÷ Eligible new users × 100
The key is to define an event that reflects genuine value. Then examine where new users stop before reaching it. A complicated setup process, unclear instructions or missing support may prevent activation.
Growth teams can test onboarding messages, product walkthroughs and simpler first steps. However, they should measure whether changes improve meaningful activation rather than merely increasing button clicks.
4.5 Referral rate and organic growth
Referral rate measures the share of customers who refer other people, based on a defined referral event. Organic growth can also include unpaid search traffic, direct visits and word-of-mouth activity, depending on the reporting method.
These metrics help teams understand whether customers contribute to growth beyond paid acquisition. Still, attribution can be difficult. Someone might hear about a brand from a friend, search for it later and convert through a paid campaign.
Use referral codes, survey questions and consistent source tracking where appropriate. Treat each method as evidence with limitations rather than a perfect record of influence. Over time, compare referral quality, conversion and retention with other acquisition sources.
5. How Influencer Marketing and UGC Fit into Growth Marketing Metrics
Influencer marketing and user-generated content can support discovery, consideration and conversion. However, they should be measured against the role they play in the customer journey. A video that builds awareness may not generate immediate purchases. Likewise, a creator who drives clicks may attract visitors who never become customers. The right measures depend on the objective and the time available for results to appear.
5.1 Measure creator campaigns beyond likes and views
Start by defining the campaign goal. For awareness, measure reach, impressions, video views and watch time. For consideration, examine saves, shares, meaningful comments, link clicks and product-page visits. For conversion, track purchases, qualified leads or another clearly defined action.
Then calculate cost per engagement, cost per view or cost per acquisition when those measures match the campaign objective. Do not compare creator performance unless the underlying definitions are consistent. Platforms may count views differently, and engagement can use reach, impressions or followers as its base.
Hobo.Video has also discussed why high engagement does not always mean high revenue. The important question is not whether a post looks popular. It is whether the content reaches the right audience and supports the intended result.
5.2 Use UGC Videos to test creative ideas
UGC Videos can show how a product works in everyday situations. They may help brands explore different demonstrations, objections, product benefits and storytelling styles. However, the format alone does not guarantee better performance.
Test creative concepts with a clear hypothesis. For example, a skincare brand could compare a routine demonstration with a video that answers a common product question. Keep the audience, offer and measurement window as consistent as possible. Then compare qualified actions and cost, not just views.
When a brand reuses creator content in paid advertising, confirm the relevant usage rights and permissions. Track production costs, licensing terms and paid amplification alongside performance. This gives the team a more complete view of the asset’s value.
5.3 Connect creator activity with business outcomes
A creator campaign may influence several stages of the customer journey. A person might watch a video, search for the brand later and purchase after visiting the website directly. A last-click report may not assign credit to the creator.
Use tagged links, campaign-specific codes and landing pages where suitable. Also review branded search, new-customer orders and post-purchase survey responses. These methods provide different kinds of evidence, but none should be treated as perfect on its own.
For a wider view of creator-led growth, explore Hobo.Video’s influencer campaign case study. Use published case-study results as examples, not guaranteed forecasts for another brand. Your product, audience, offer and campaign execution can produce different outcomes.
5.4 Where AI influencer marketing and AI UGC fit
AI influencer marketing and AI UGC can help teams explore creative variations, organise workflows and speed up some production tasks. Still, automation does not remove the need for sound measurement. Teams should check content accuracy, audience suitability, rights, disclosures and brand consistency.
If you test AI-assisted creative, compare it with a relevant baseline. Measure production time and cost alongside performance. Also document how the content was created and whether platform rules or campaign agreements require specific disclosures.
The strongest process combines tools with human judgement. Data can show which variation performs better under tested conditions. People still need to decide whether the content is truthful, appropriate and useful to the audience.
6. Build a Growth Marketing Dashboard and Turn Metrics into Decisions
A useful dashboard should make decisions easier, not simply display more numbers. It should connect the business goal with the leading indicators that explain progress and the financial outcomes that confirm results. For example, a team trying to improve profitable sales might monitor qualified traffic, conversion rate, CAC, contribution margin and repeat purchases. Use consistent UTM parameters to identify which campaigns bring visitors to your website. Follow the Google Analytics guide to UTM campaign tracking to organize campaign data.
6.1 Choose a small set of core metrics
Start with a primary outcome and a handful of supporting measures. A subscription business might track new customers, CAC, activation, churn, NRR and payback period. A D2C brand may focus on new-customer CAC, conversion rate, contribution margin, repeat purchase rate and blended marketing efficiency.
Avoid giving every metric equal importance. Instead, identify which numbers explain the outcome and which ones simply provide context. If the main goal is profitable growth, a rise in impressions is not enough to justify increasing spend.
Write down each metric’s formula, owner, source and reporting frequency. This reduces disagreements when two platforms report different figures. It also makes the dashboard easier to maintain as the team grows.
6.2 Review leading and lagging indicators together
Leading indicators can help teams spot potential changes before revenue results become clear. Examples include activation, qualified traffic, checkout completion and product engagement. Lagging indicators include revenue, gross profit, churn and customer lifetime value.
Both groups matter. A leading indicator can reveal a problem early, but it does not guarantee a future result. A lagging indicator confirms what happened, but it may not explain the cause.
Review metrics at a cadence that suits the business. Active paid campaigns may need frequent checks on spend and tracking. Retention and customer value often require longer observation windows. Avoid changing strategy because of one unusual day unless a clear operational issue needs immediate attention.
6.3 Create a simple monthly growth review
Use the following sequence in your review meeting:
- Goal: State the business outcome the team wants to improve.
- Result: Show the primary KPI against the target and previous period.
- Drivers: Identify the segments or funnel stages that explain the change.
- Costs: Check the complete cost picture, not only media spend.
- Evidence: Separate confirmed causes from possible explanations.
- Action: Assign one or two tests with a named owner and deadline.
- Follow-up: Record the result and decide whether to continue, change or stop.
This structure turns reporting into a learning process. It also helps teams explain disappointing results without hiding them. A test that fails can still be valuable when it rules out an assumption and informs the next decision.
6.4 Common mistakes that make growth metrics misleading
The first mistake is using inconsistent definitions. A CAC calculation that excludes creator fees cannot be compared fairly with one that includes them. Likewise, revenue-based LTV should not be treated as gross-profit LTV.
The second mistake is relying on blended averages. One acquisition channel may bring valuable customers while another generates low-quality orders. Segment the data when sample sizes support meaningful comparison.
The third mistake is confusing correlation with causation. A campaign may receive credit for sales that would have happened anyway. Where feasible, use holdout groups or controlled experiments to estimate incremental impact.
Finally, avoid copying a benchmark without understanding its source. Business models, margins, sales cycles and customer behaviour differ. Use external benchmarks as context, then compare them with your own historical performance and unit economics.
Key Takeaways, and Next Steps
Growth marketing metrics: a practical checklist
Before making a budget or growth decision, review these points:
- Start with the goal: Choose metrics that answer a clear business question.
- Calculate CAC honestly: Include the relevant acquisition costs and count new customers consistently.
- Estimate LTV carefully: State whether you measure revenue or gross profit, and document the assumptions.
- Read LTV in context: Check margin, operating costs and payback rather than relying on the ratio alone.
- Treat ROAS correctly: It measures attributed revenue against advertising spend, not overall profit.
- Monitor NRR and churn: Existing customers can expand or shrink recurring revenue.
- Measure the full funnel: Connect acquisition, activation, conversion and retention.
- Evaluate creator campaigns by objective: Track exposure, meaningful engagement and business outcomes.
- Keep definitions consistent: Record formulas, data sources and reporting windows.
- Turn insights into action: Assign an owner, test a change and review the result.
The central lesson is simple: sustainable growth comes from understanding the relationships between acquisition cost, customer value, retention and revenue. One impressive metric cannot replace that full picture.
About Hobo.Video
Hobo.Video is India’s leading AI-powered influencer marketing and UGC company. With over 2.25 million creators, it offers complete campaign management for brand growth. Combining AI and human strategy ensures maximum ROI. Services include:
- Influencer marketing
- UGC content creation
- Celebrity endorsements
- Product feedback and testing
- Marketplace and seller reputation management
- Regional and niche influencer campaigns
Trusted by top brands such as Himalaya, Wipro, Symphony, Baidyanath, and the Good Glamm Group.
The right creators can unlock new levels of brand growth. Register now and start your campaign.
Ready to grow your influence and earn doing what you love? Join the fam.
Frequently asked questions
What are growth marketing metrics?
Growth marketing metrics measure how effectively a business attracts, converts, retains and grows customers. Common examples include CAC, LTV, conversion rate, churn, NRR, ROAS and payback period. The right selection depends on the business model and goal. A useful dashboard connects these measures so teams can identify bottlenecks, assess spending and choose the next experiment.
Which growth marketing metrics should beginners track first?
Start with a few measures that match your business goal. Many businesses benefit from tracking conversion rate, CAC, revenue and retention. Subscription companies should also understand recurring revenue, churn and NRR. D2C brands may need repeat purchase rate and contribution margin. Add more metrics only when they help answer a real question or explain a change in performance.
How do you calculate customer acquisition cost (CAC)?
Divide the relevant acquisition costs for a defined period by the number of new customers acquired during that period. Include costs consistently, such as paid media, creator fees, agency support and sales expenses where relevant. Then calculate CAC by channel if reliable data exists. A clear definition helps teams compare results and prevents costs from disappearing from the calculation.
What is a good LTV ratio?
There is no universal ratio that works for every business. A 3:1 ratio is often discussed as a directional target in SaaS, but it may not suit every model or growth stage. The result depends on margins, retention, payback, operating costs and how LTV is calculated. Compare gross-profit-based LTV with consistently measured acquisition costs before using the ratio to guide investment.
What is the difference between ROAS and ROI?
ROAS compares revenue attributed to advertising with advertising spend. ROI compares net return with the investment cost. A campaign can report strong ROAS and still produce little profit after product costs, discounts, fulfilment and other expenses. Therefore, use ROAS to assess attributed advertising revenue, then calculate contribution and ROI using a clearly defined cost and return method.
How often should a business review growth marketing metrics?
The review schedule depends on the metric and the business. Teams may check active campaign spend and tracking frequently, while monthly reviews can help assess acquisition efficiency and revenue. Retention and lifetime value often need longer observation windows. Choose a cadence that gives enough data to support decisions, and avoid reacting to small fluctuations without checking their cause.

 Sahil Singh